If you’re anything like me, I like to shop online over shopping in person. Such as using instacart for my groceries or amazon for the various things I need in my life.
However, do you ever wonder how these companies are able to recommend you products that are complementary to the product you are buying. For example, this morning I was making one of those quick instacart orders and I always find myself approving 99% of the time the recommended replacement product if the product I wanted was out of stock. That’s pretty incredible that they’re able to have those recommendations very accurately. Another example is if you are buying a camera on amazon, they may recommend purchasing a memory stick along with the camera.
These examples are what we call association rules. However, in order to acquire those associations rules we need a large dataset of actual customer purchases as well as a little technique called market basket analysis.
Major retailers such as Amazon, Best Buy, and Walmart to name a few, utilize this technique in order to understand deeper the various association rules between products. Which helps them better optimize product placement among shelves, recommendations, and promotions.
In this post, I’ll be going through a quick intro to market basket analysis, covering some of the definitions, and how to start using this technique with python. So that you can do your own market basket analysis during this lockdown or in the future, if you’re reading this ages from now.
Different Types of Association Rules
Substitution rules refers to products which are recommended to replace one another, for example if they did not have your chicken thighs available, did you want chicken breasts instead?
Complementary assocations refers to items that are commonly bought together. My camera example above is an example of this rule.
Trigger associations refer to items when bought, trigger other kind of purchases. For example, when shopping for toilet paper, you may be also shopping for other household supplies in the same time. Similar to complementary association.
Market Basket Analysis Definitions & Metrics You Need to Know
Basket refers to the group of items bought at one time. Look at your last grocery bill, that is a basket.
Support refers to the relative frequency of a product/products in the analyzed dataset of baskets.
Confidence refers to how likely the association of products occur. A confidence of 50% would mean products X and Y were purchased together 50% of the time. This is great to figure out examples of complementary associations, product recommendations, and common baskets.
Lift refers to the ratio of confidence to expected confidence. The higher the lift value, the stronger the associations between two products.
Conviction refers to ratio of excepted frequency that the antecedent occurs without the consequent.
How do we do market basket analysis with python?
Luckily there is a great package called mlxtend that we could use to help us do some market basket analysis easily on python.
Below, I will show you how to use this package in order for you to do your own explorations with this method. We will be using a common learning dataset for this type of analysis, the online retail dataset. This is a transnational dataset which contains all the transactions occurring between 01/12/2010 and 09/12/2011 for a UK-based and registered non-store online retail.
import pandas as pd
#load the dataset with the link to the excel file on the UCI website
df = pd.read_excel('http://archive.ics.uci.edu/ml/machine-learning-databases/00352/Online%20Retail.xlsx')

#the dataset looks like this
df[10000:10005]
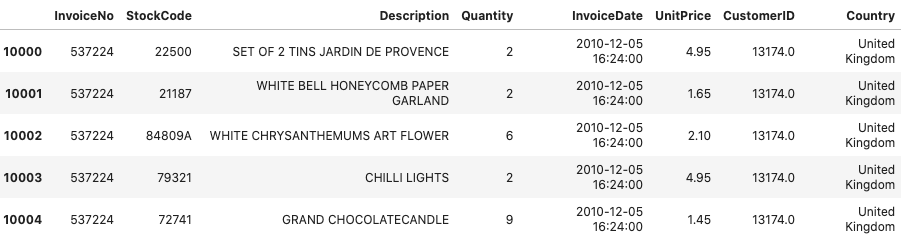
This is a little snapshot of invoice number 537224. It seems as if the customer bought grand chocolate candles and chilli lights together. However, this is just one invoice among thousands in this dataset. But from here we can do some interesting analysis.
#Creating baskets, narrowed our dataset to just France for easier analysis.
df_baskets = df[df['Country'] == "France"].groupby('InvoiceNo').apply(lambda x: list(x['Description']))

#Importing our Transaction Encoder preprocessing method
from mlxtend.preprocessing import TransactionEncoder

#Instatiate
te = TransactionEncoder()
#Fit to array
te_ary = te.fit(df_baskets).transform(df_baskets)
#Covert array of True False to integers 1 and 0s
te_ary = te_ary.astype('int')

#New Dataframe with our prepocessed data
df_te = pd.DataFrame(te_ary, columns = te.columns_)
df_te.head()
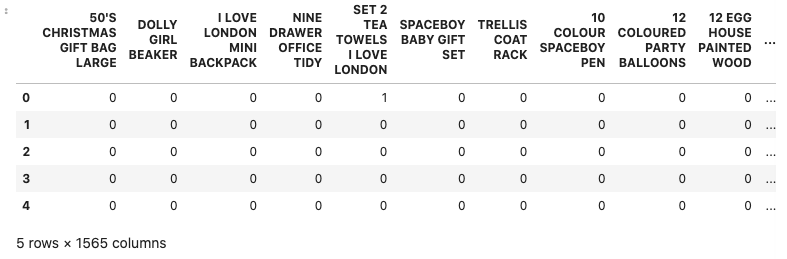
Here, each row is a basket or items that a customer purchased at the same time.
from mlxtend.frequent_patterns import apriori
from mlxtend.frequent_patterns import association_rules

#Instatiate the apriori analysis
apriori = apriori(df_te, min_support = 0.1, use_colnames = True)

#New Dataframe to store all the associated rules for each combination of items.
df_rules = association_rules(apriori, metric = 'lift', min_threshold = 1)

df_rules.head()
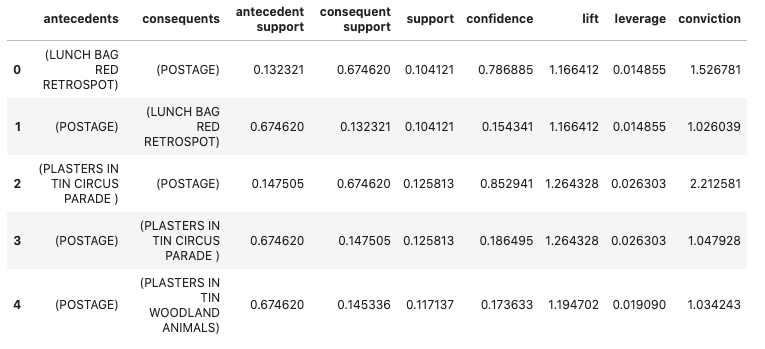
From here we can start analyzing the various association rules from our dataset.
For example in the first row, we can see that the confidence is about 78%, which means these two combination of items occur together 78% of the whole dataset. Support is at 10%, which refers that these combination of items occur 10% in the whole dataset.
Disclaimer: I think Postage here is not a product, but actually the postage/shipping. So there is some data cleaning you may want to do garner better insights.
There you go, this the basics of figuring out the different association rules with a basket dataset in python. In the near future, I’ll do a more in depth market basket analysis in the near future to be posted on my GitHub. Stay tuned!